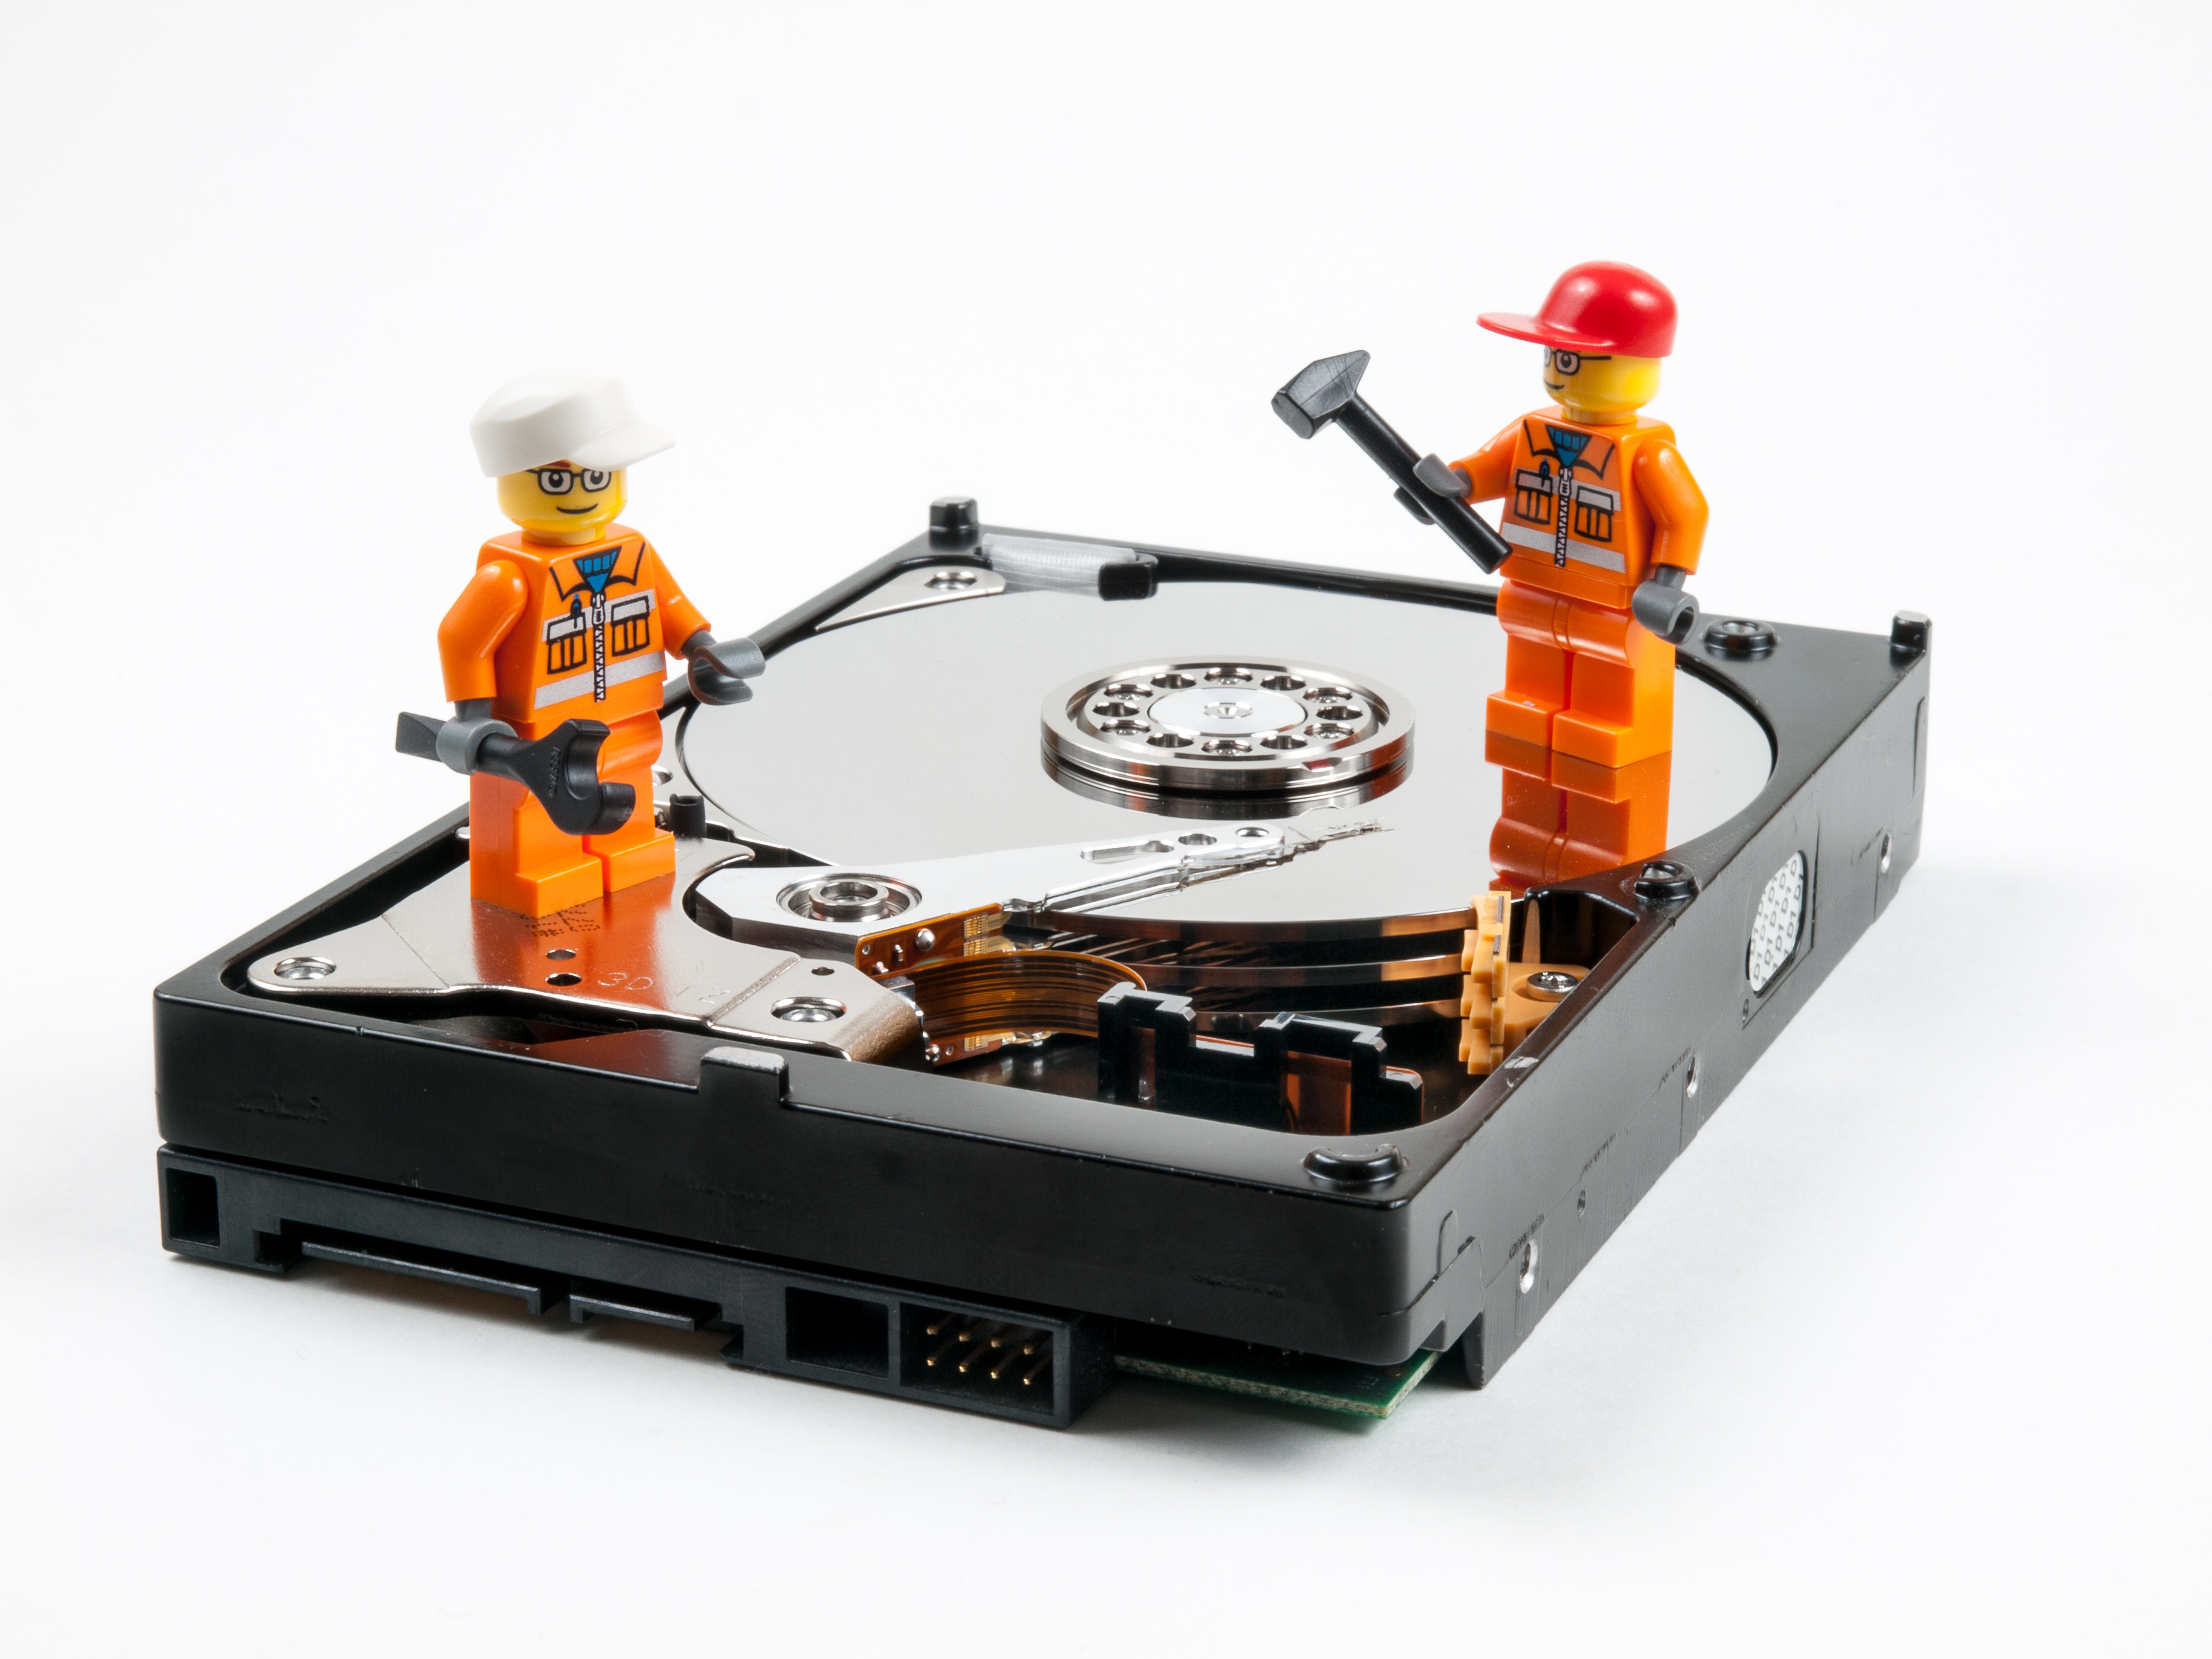
Managing digital assets is now a critical part of our society. I wanted to put together some notes for a presentation on personal digital archiving that I’ve proposed for the Covenant’ MidWinter gathering of pastors. If this proposal is accepted, this post will be a first, rough draft of the content I hope to cover there. Continue reading “Personal Digital Archiving for Clergy”
Working with Chicago Data (part 1)
We are still talking a lot of data at North Park – in particular Chicago data. So I’m going to start getting my hands dirty working with this data to build capacity for future partnerships with faculty and students. So here is the first in what I hope to be many installments of the “Working with Chicago Data” series.
Mapping Chicago’s Grocery Stores
First step: Download data from the Chicago Data Portal (https://data.cityofchicago.org/). I’m using the Grocery Store 2013 dataset for this example.
The data itself seems pretty clean and well formatted. I’m going to use Tableau for this example because that’s the tool I’m learning right now. I opened Tableau and imported the spreadsheet from the Chicago Data Portal. I ended up creating 4 different visualizations based on this data.
The first is a map of grocery store locations. It uses the latitude and longitude from the dataset to create points. Pretty standard and vanilla.

These next map is much more interesting. It takes into account the size of the store (measured in square footage) and codes that as size and color. Larger stores have larger, darker circles.

The last two maps were just variations on the second map. One version filtered out “small stores” that were less than 10,000 square feet. The other filtered out stores with the work “liquor” in the title. On a technical levels, these filters were easy to apply. However, I’m completely aware of the cultural assumptions I’m bringing to bear here. When I (white, affluent, middle class) think about a grocery store I think about a large store that doesn’t have the word “liquor” in the title.
That’s that! It was pretty easy to get this data and put it to use in the form of a map. I used Tableau here but I could also use Excel (with the power map add) or a more specialized tool like ArcGIS.
In terms of next steps or extensions:
- It would be interesting to compare results using a different tool. Might be good to showcase the basic steps for using each tool.
- It would be very interesting to add neighborhood boundaries and/or other information such as demographic information and/or economic status. I’ll have to look at ways to incorporate this data.
- It would also be very interesting to combine this data with user feedback like Yelp reviews.
Sending Article Level Metadata from OJS to DOAJ
That’s a pretty scary sounding title…but the process was actually super simple. I just want to document it here for my own future reference and to share with others looking to do the same thing.
Background
In my role as Technical Advisor for the Covenant Quarterly, I oversaw the application process for our journal into the Directory of Open Access Journals. Including it here seemed important because this was the main repository for Open Access Journals and it seemed like the logical place. Once the journal was accepted – which took quite a while! – we have the option to add article level metadata to that index. Here is our journal page along with the content of the journal – https://doaj.org/toc/2380-8829 Continue reading “Sending Article Level Metadata from OJS to DOAJ”
Google Scholar Tutorial
As a way to document and share my work, I wanted to post this short online tutorial I made about using Google Scholar and the Brandel Library. I manage the data feeds (from SFX and now from EBSCO) that make these library links possible but I also feel like I needed to do more to make these connections apparent to our users. There are a number of reasons for this:
- First, I love Google Scholar and I find it very useful for known item searching. Given students and faculty another tool seems very helpful.
- Second, given the movement toward Open Access, I think “open” tools like Google Scholar do a better job searching that “gray” content that traditional databases struggle with.
- Lastly, the connections between Google Scholar and the Library are seamless and relatively transparent – which are good things! – some faculty believe that everything is “on Google Scholar” without realizing that the library is providing many of those links. So I think this is an opportunity to demonstrate value and market the library.
The tutorial making process at North Park is really quite nice – we have a dedicated terminal with a high quality microphone and specialized programs like Audacity and Camtasia that make it easy to create high quality tutorials. I’ve done several and am definitely getting better at using these tools – though I still don’t love the sound of my voice!
Digitizing Wire Recordings
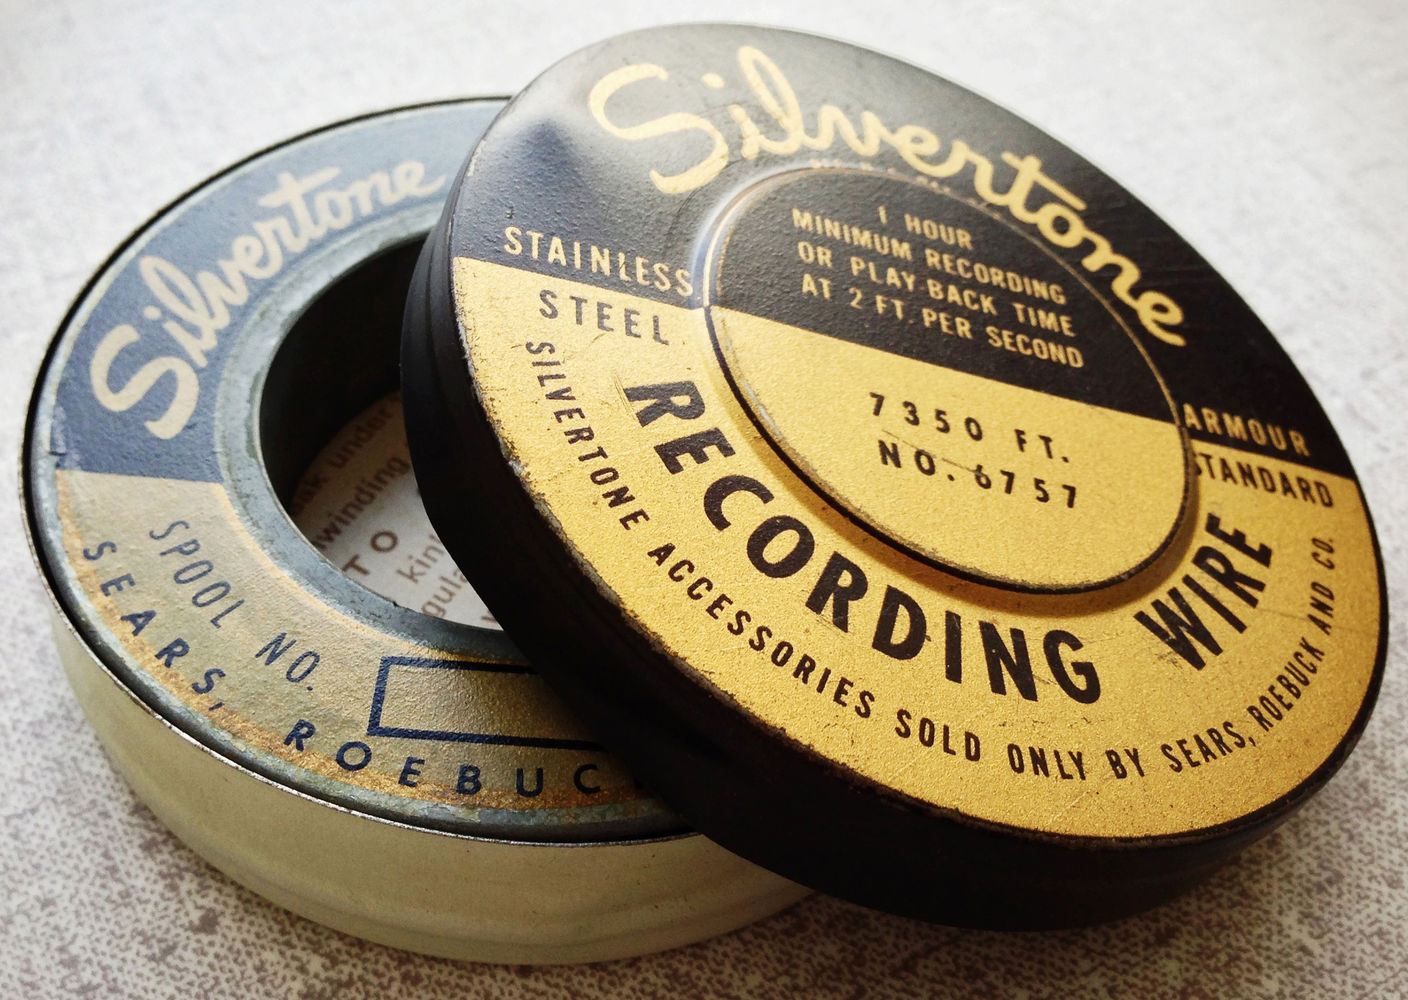
An interesting side project that I thought I could write about here. A neighbor asked me about digitizing some “Wire Recordings” that her grandfather had made of her family. I had never heard of this media format so I took to twitter to ask around: Continue reading “Digitizing Wire Recordings”
Tools for Data Analysis
In addition to providing the raw data to our campus community, I think the library can take a leadership role in providing the tools and expertise to mine this data into something usable and useful. However, many of the tools that are used to transform data are highly specialized and have a pretty steep learning curve. So I’m going to work to provide an overview of the tools available and focus on those that would be useful in the context of undergraduate education. Continue reading “Tools for Data Analysis”
Chicago Data for Undergraduate Research
We are talking a lot about data, data literacy, and how North Park University can use Chicago data in the classroom. There are already a lot of courses using data in instruction and research so part of my work is figuring out what is already happening. Continue reading “Chicago Data for Undergraduate Research”
Interlibrary Loan Data Analysis and Visualization
I’m working on improving the interlibrary loan services at North Park as well as improving my skills in statistics and data visualization. I’ve combined these two interests to look at analyzing and visualizing our interlibrary loan data using Tableau. Continue reading “Interlibrary Loan Data Analysis and Visualization”
Northfield Historical Society (behind the scenes) updates!
I just finished some “behind the scenes” updated to the Northfield Historical Society site and wanted to document that process here. It was definitely a bit messy at times and quite labor intensive, but I think it was the best way to deal with the situation I faced.
Background
Starting last year, I got about 260 images from the old Northfield Historical Society site (archived here: http://www.oldsite.northfieldhistoricalsociety.org/). These images varied greatly in quality; there were a few large, high quality TIFF images but most files were small JPEGs the size of thumbnails. In order to get intellectual control over these files, I renamed them and manually formatted metadata (using Dublin Core) to create an Omeka site. This was part of my “Web Design for Organizations” class I took through GSLIS.
However, the low quality images didn’t look great online. In fact, they looked pretty bad. So I inquired if higher quality versions of the files existed somewhere else. After some searching, they were able to get higher quality images from another source. Success!
This new batch of files was a treasure trove…but also had a few problems:
- Very different file naming conventions.
- Included many additional photos not found in the initial ingest.
- Did not include all the files from the initial ingest.
- Included both TIFF and JPEG images.
So I needed to match the new files with the older set of images (keeping the highest quality image in each case) and then incorporate the new files into the file naming convention I established earlier.I used two tools that were particularly helpful in this process. One was a Batch Rename tool and the other was a Image Duplication tool. Both were extremely helpful.
Results
Here are two screenshots of the same “item” with two very different image files.

The improvement is hard to miss!
Review: “Library-as-Publisher: Capacity Building for the Library Publishing Subfield”
I’ve been tasked with creating a “Roadmap to Digital Publishing” for the Brandel Library. I’ll post the draft of the “roadmap” I develop later on, but right now I’m in the research phase of the project and wanted to document the sources I’m reading. I could include this as a bibliography in the other post, but this is happening chronologically first and I thought it would be pretty interesting to document. So here is goes!
Library-as-Publisher: Capacity Building for the Library Publishing Subfield
Katherine Skinner, Sarah Lippincott, Julie Speer, Tyler Walters
Volume 17, Issue 2: Education and Training for 21st Century Publishers, Spring 2014 DOI: http://dx.doi.org/10.3998/3336451.0017.207
Although this article focused more on the professional developement needs of library staff to take on publishing activities, it also provided a very good overview and definition of the library publishing efforts and section on “Core Knowledge and Skills for 21st Century Publishers” could provide a helpful guide.
Definitions
This article borrows the following definition from the “Library Publishing Coalition” (http://librarypublishing.org/about-us) that defines library publishing as:
the set of activities led by college and university libraries to support the creation, dissemination, and curation of scholarly, creative, and/or educational works.
This relatively basic definition seems like a good shared starting point and distinguishing library publishing form other forms of digital humanities work.
Knowledge and Skills
The list of core knowledge and skills identified in this article proved to be very helpful as well. Here is a summary of that section – with my summarizing comments in the form of questions:
- Scholarly Publishing Context – what is happening in the world of academic publishing?
- Academic Context – why is the role of the library within the larger institution? to publish something unique? enhance the institutional brand?
- Soft Skills – who do you need to build relationships with? What political connections need to be forged?
- Business Planning and Management – what is your business plan? who is your audience?
- Technology and Workflows for Production, Distribution, and Preservation – do you have the technology and workflow to publish (and care for) everything you want to publish? For text, audiovisual, datasets, interactive things, etc.
- Editorial and Acquisitions – can you get and edit the stuff you want to publish?
Overall, this was a very helpful article. The two sections I’ve highlighted were particularly relevant – even as I read the article from an “institutional roadmap” when the original article was written in terms of professional skills and development. The Notes section as provided to be quick valuable in highlighting other relevant sources and authorities.